
How China Built a Global Electric Vehicle Industry Through State Capitalism, and How Washington Answered with Tariff Wall
Editorial Analysis | June 2026
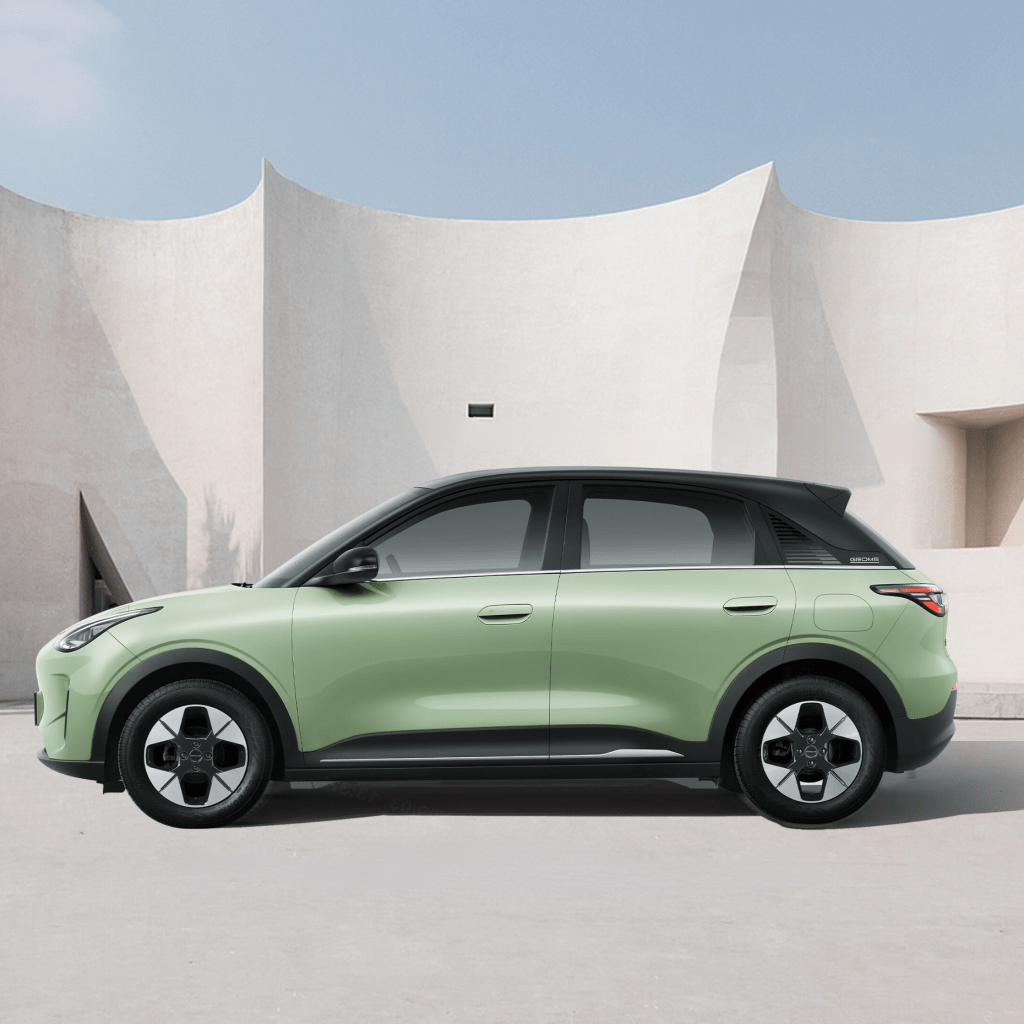
(This headline image is the Geely Geome Xingyuan is a compact hatchback that sells for under $10,000)
I. The Industrial Reset: China’s EV Strategy from 2009
When China formally identified new energy vehicles as one of seven strategically important developing sectors under its Twelfth Five-Year Plan around 2010, the decision reflected a diagnosis rather than an aspiration. The internal combustion engine represented a technology where intellectual property, manufacturing expertise, and brand equity belonged overwhelmingly to American, German, and Japanese companies. Attempting to compete on conventional automotive terms would have required decades of technology licensing, joint ventures operating under terms defined by foreign principals, and persistent structural subordination within global supply chains that Chinese firms did not control. Electric vehicles offered a different entry point, a technology still in its infancy globally, where scale and manufacturing efficiency would matter as much as legacy patent portfolios.
The Chinese state’s response to this strategic window was not incremental. From 2009 to 2022, the national and local governments directed in excess of 200 billion renminbi, equivalent to approximately $29 billion at prevailing exchange rates, into subsidies and tax exemptions directly related to EV industry development, according to analysis published by MIT Technology Review drawing on official statistics. This figure understates total government mobilisation because, as the Center for Strategic and International Studies calculated in a 2024 study authored by Scott Kennedy, the conservative aggregate of Chinese government support to the EV sector between 2009 and 2023 was $230.9 billion when factoring in national buyer rebates, infrastructure funding, state research and development programmes, government procurement, and sales tax exemptions. The CSIS study explicitly excludes local government land subsidies, preferential utility rates, and cheap credit from state-owned banks, characterising its own estimate as conservative.
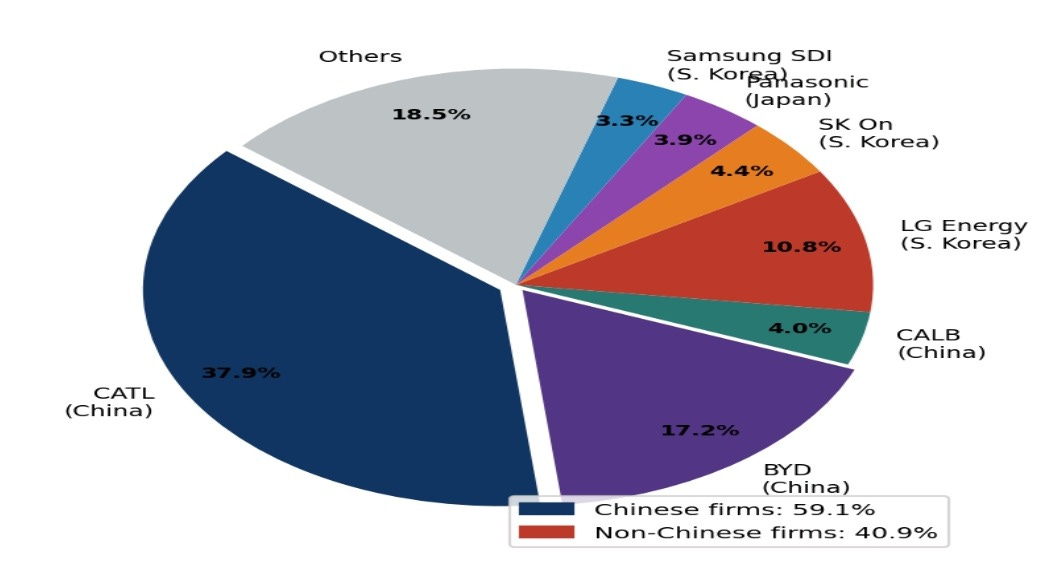
The operational effect of this capital allocation became visible in battery manufacturing before it became visible in vehicle sales. Contemporary Amperex Technology Co. Limited, founded in 2011 as a spin-off from Amperex Technology Limited, built manufacturing scale through a combination of proprietary lithium iron phosphate chemistry, supply chain vertical integration, and client relationships with both domestic manufacturers and foreign majors including Tesla, BMW, Volkswagen, and Mercedes-Benz. By 2024, CATL commanded a 37.9 percent share of global EV battery installations according to South Korean market research firm SNE Research, remaining the only battery supplier globally with a share exceeding 30 percent. BYD Auto, which had been manufacturing batteries since 2003, ranked second with a 17.2 percent global share. Chinese firms collectively held approximately 59 percent of global EV battery market capacity in 2024, a figure that rose to approximately 69 percent by the January-October 2025 period per updated SNE Research data.
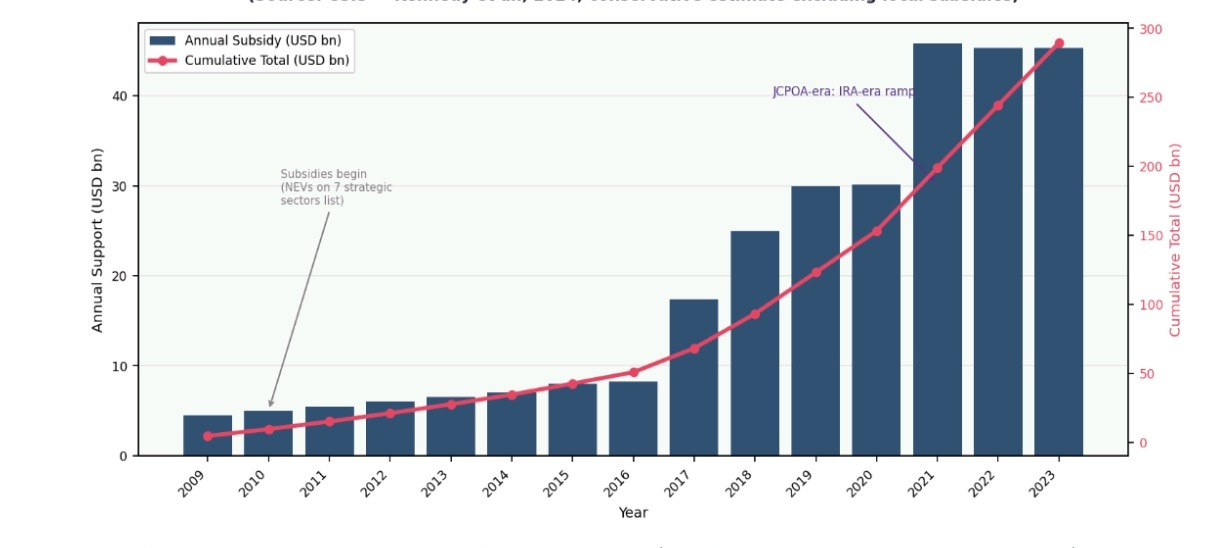
Battery cost is the critical price variable in EV economics, constituting between 30 and 40 percent of total vehicle manufacturing cost. The scale economies achieved by Chinese battery producers through sustained output expansion translated directly into per-unit cost reductions that competitors operating at lower volumes could not readily match. CSIS data show that Chinese government subsidy support per vehicle fell from approximately $13,860 in 2018 to under $4,600 in 2023, not because support declined in absolute terms, aggregate annual subsidies actually tripled between 2018 and 2023, reaching $45.3 billion, but because sales volume expanded faster than subsidy outlay, reducing the per-unit denominator. The subsidy per vehicle figure in 2023 was, the CSIS study notes, lower than the $7,500 credit extended to qualifying vehicle buyers under the American Inflation Reduction Act. The implication is that by the time Western governments began imposing tariffs, Chinese cost leadership had developed a structural foundation that consumer subsidies alone could not replicate.
Figure 2: Chinese Government Support for EV Sector, 2009–2023 (Estimated Annual and Cumulative, USD billions)
BYD’s trajectory within this policy environment illustrates the interaction between state support and firm-level technological strategy. BYD received $3.7 billion in direct government subsidies between 2018 and 2022 alone, including $2.2 billion in 2022, a figure that contributed to, but did not fully explain, its competitive position. Peer-reviewed analysis published in ScienceDirect in 2025 found that BYD’s share of China’s new energy vehicle market reached 34.1 percent in 2024, and that its Blade Battery technology, designed to pass nail-penetration safety tests, had persuaded premium original equipment manufacturers of lithium iron phosphate chemistry’s suitability for applications beyond the budget segment. BYD’s vertical integration, encompassing battery cell production, vehicle assembly, and increasingly semiconductor design, allowed it to reduce dependence on third-party suppliers in ways that insulated production costs from global commodity shocks. In 2024, BYD sold 4.25 million vehicles globally, surpassing Tesla’s 1.8 million and ranking it seventh among global automakers by sales volume.
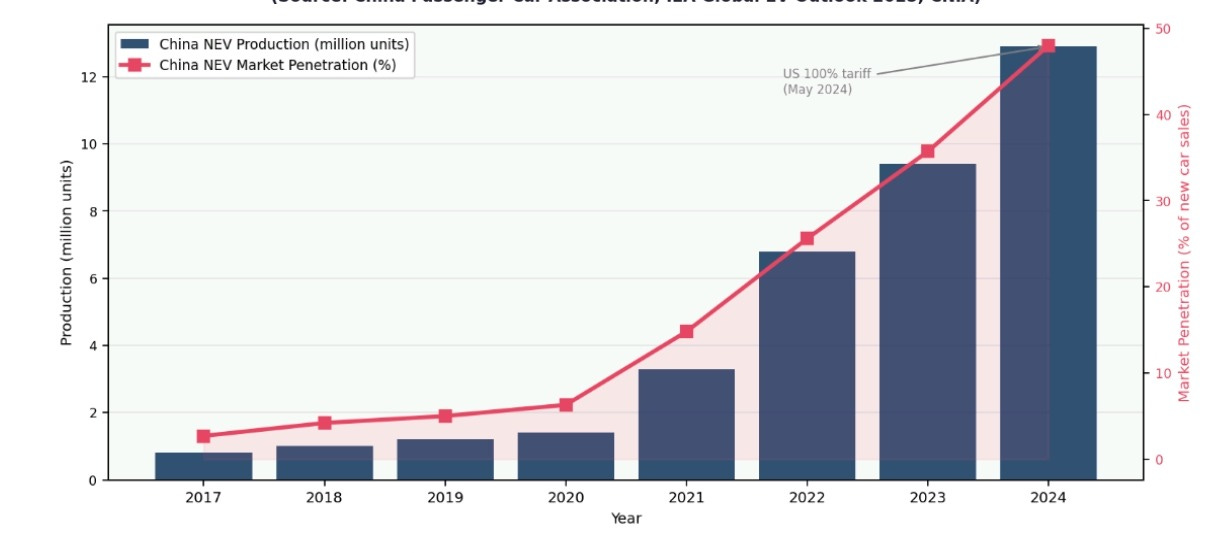
Figure 4: China NEV Production Volume and Domestic Market Penetration, 2017–2024
II. The Tesla Variable and the Costs of Ecosystem Dependence
Tesla’s relationship with China’s EV industrial ecosystem represents one of the more instructive episodes in recent automotive history, demonstrating how the conditions that enabled a foreign company’s profitability also accelerated the competitive maturation of domestic rivals. Tesla signed an agreement with the Shanghai municipal government in July 2018 to construct what became Gigafactory Shanghai, the first wholly foreign-owned automotive manufacturing facility in China, established after the Chinese government revoked the joint-venture requirement for foreign automakers in 2018. Construction began in January 2019, and the first production vehicles delivered from the factory in December 2019, with Tesla’s own Form 8-K filing from that period noting that the Shanghai facility was approximately 65 percent less expensive in capital expenditure per unit of capacity than its comparable American production system.
The cost advantage Tesla derived from its Shanghai operation was a direct function of the manufacturing ecosystem China had constructed around EV production: suppliers clustered in proximity, logistics infrastructure calibrated for high-volume component movement, labour market flexibility shaped by years of electronics and automotive manufacturing scale, and an administrative environment that processed regulatory approvals faster than any Western equivalent. Tesla did not build this ecosystem; it inherited it. The company’s Shanghai production allowed it to serve not only the Chinese domestic market but also key Asia-Pacific export markets including Australia and New Zealand, with the facility eventually reaching a rated capacity exceeding 750,000 vehicles per year by mid-2023.
The unintended consequence of Tesla’s Shanghai integration was competitive rather than operational. Tesla’s presence demonstrated to Chinese manufacturers what modern EV production economics looked like in their own factories, with their own supply chains, at their own cost base. By the early 2020s, Chinese manufacturers had identified a strategic divergence from Tesla’s product philosophy: instead of maximising range, features, and touchscreen integration, firms such as Wuling, BYD’s urban divisions, and later Xiaomi began stripping EVs down to functional essentials, smaller battery packs, reduced range suited to average urban trip distances, fewer software-dependent features, and pricing the resulting product at points that made the vehicle a practical commuting tool rather than an aspirational consumer statement. BYD’s Seagull, launched in 2023 with a retail price below $10,000 in the Chinese domestic market, became the most visible symbol of this approach. By 2025, Tesla’s Chinese market share had declined from approximately 9 percent in 2024 to 6.5 percent, with its Shanghai Gigafactory recording an 11.7 percent year-on-year delivery decline in the second quarter of 2025 as domestic competitors intensified price competition.
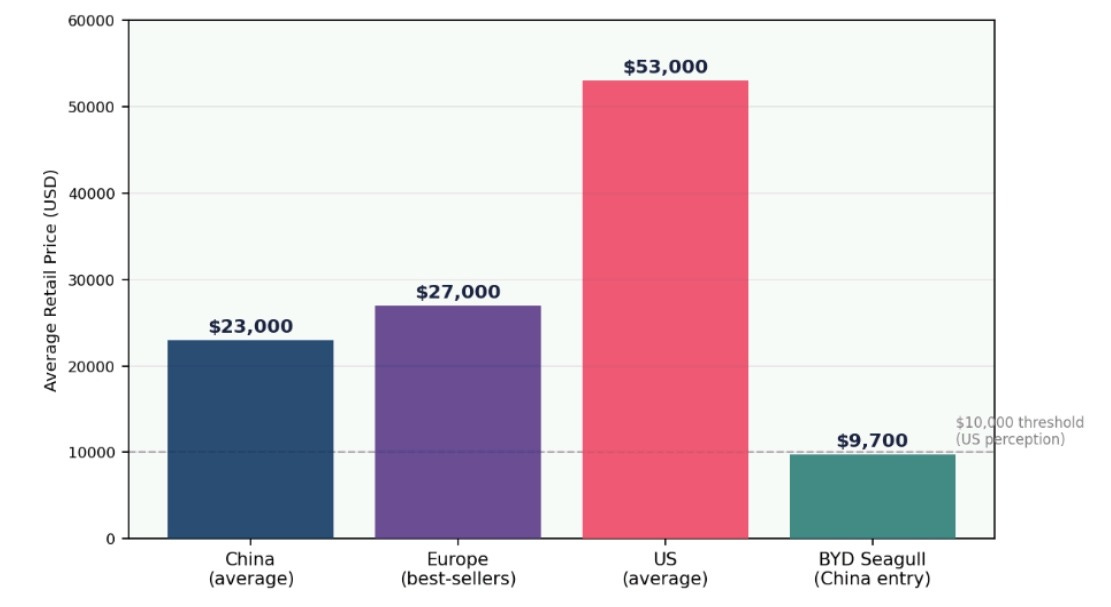
The Seagull’s existence posed a structural rather than a stylistic challenge to American automotive policy assumptions. American EV pricing had been constructed around a premium product logic: vehicles positioned for upper-income buyers, with federal tax credits partially bridging the gap toward middle-income purchasers, but with the fundamental cost architecture reflecting Western labour costs, supply chain fragmentation, and manufacturing overhead. The average American EV sold for approximately $53,000 in 2024 against a Chinese average of $23,000, a gap of more than 100 percent that tariffs could maintain by exclusion, but that domestic production economics could not close without a comparable industrial reorganisation.
Figure 5: Average EV Consumer Retail Price Comparison by Market, 2024 (USD)
III. Washington’s Answer: Tariffs, the IRA, and the Exclusion Architecture
The American policy response to Chinese EV cost leadership developed through two parallel legislative and regulatory tracks that converged around 2024 into an effective prohibition on Chinese vehicle market access. The first track drew on trade law infrastructure dating to 1974. Section 301 of the Trade Act of 1974 grants the United States Trade Representative authority to impose trade restrictions or negotiate trade agreements when a foreign country’s practices are determined unreasonable, discriminatory, or burdensome to American commerce. An investigation initiated in 2017 under the first Trump administration produced findings that supported a Section 301 action against a wide range of Chinese imports, establishing the legal and political foundation for sector-specific tariff escalation.
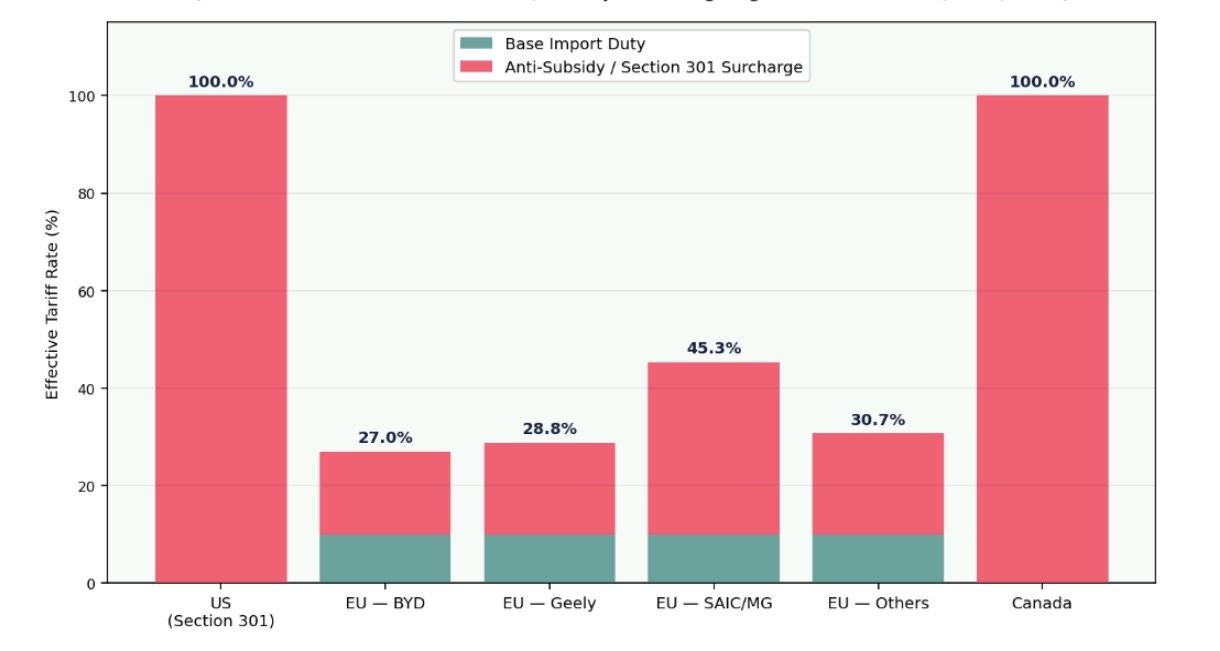
On 14 May 2024, the Biden administration announced a 100 percent tariff on Chinese electric vehicles, effective in 2024, raising the combined levy to 102.5 percent when added to pre-existing Section 301 charges. The Office of the United States Trade Representative framed the decision as a response to unfair Chinese trade practices including subsidisation and overcapacity. The Roosevelt Institute, in a contemporaneous analysis, characterised the tariff as providing critical support to the historic public and private sector decarbonisation investments under the Inflation Reduction Act, the CHIPS and Science Act, and the Bipartisan Infrastructure Law, framing the exclusion of Chinese vehicles as protective of American industrial investment rather than contrary to climate goals.
The practical arithmetic of the tariff regime is dispositive. A Chinese EV with a factory gate price of $10,000 becomes, after the 102.5 percent tariff, approximately $20,250 before shipping, regulatory compliance costs, dealer margins, and profit requirements are added. An analysis of the effective price transformation suggests a landed retail cost in the range of $25,000 to $30,000, depending on logistics, certification, and commercial margins, a figure that, while nominally competitive with some American domestically produced EVs before incentives, qualifies for none of the Inflation Reduction Act tax credits that reduce the effective cost of qualifying American and allied-nation vehicles. The commercial value proposition of the low-cost Chinese product is therefore extinguished not by a single measure but by the layering of multiple instruments, each individually defensible, collectively decisive.
The second legislative track was the Inflation Reduction Act of 2022, Public Law 117-169, signed on 16 August 2022. The Act’s Section 30D clean vehicle credit provisions required, as conditions for qualifying for the $7,500 credit, that electric vehicles be finally assembled in North America, that battery components be sourced from qualifying North American or trade-agreement-partner countries, and that battery-critical minerals not originate from what the statute termed foreign entities of concern. The FEOC definition, subsequently elaborated through Treasury Department rulemaking, effectively classified Chinese battery manufacturers and critical mineral processors, which together supply the majority of global battery manufacturing input, as disqualifying sources. Congressional scrutiny of the implementing rules produced H.R. 7980, the End Chinese Dominance of Electric Vehicles in America Act of 2024, which sought to tighten the FEOC definitions further to capture licensing and contractual arrangements that might otherwise permit FEOC-linked components to flow through nominally qualifying supply chains.
The combined effect of Section 301 tariffs and IRA FEOC provisions created a two-layer exclusion mechanism: tariffs eliminated price competitiveness for direct Chinese imports, while FEOC rules disqualified Chinese-component vehicles from the subsidy regime that supported domestic EV adoption. An American consumer wishing to purchase an EV in 2024 confronted a market in which the cheapest available qualifying vehicles carried significant premium over Chinese alternatives they could not legally access at competitive prices, and in which the subsidy architecture had been explicitly designed to reward supply chains constructed around American and allied-nation manufacturing rather than the lower-cost Chinese ecosystem.
Figure 3: Effective Tariff Rates on Chinese Battery Electric Vehicles, 2024
IV. The European Divergence: Anti-Subsidy Procedure and the Structural Limits of Calibration
The European Union’s response to Chinese EV cost competition took a different procedural form that produced more moderate but still substantial trade barriers. Following a nine-month anti-subsidy investigation initiated ex officio by the European Commission in October 2023, notably without a formal petition from European industry, a departure from standard countervailing duty procedure, the Commission issued provisional countervailing duties in July 2024 and definitive duties under Implementing Regulation 2024/2754, effective 30 October 2024, for a five-year period.
The definitive duty rates reflected the Commission’s firm-specific subsidy calculations: BYD faced a 17 percent countervailing duty, Geely a 18.8 percent duty, and SAIC, which had declined to cooperate fully with the investigation, a 35.3 percent rate. Other cooperating manufacturers not individually sampled received a weighted average of 20.7 percent, while non-cooperating producers faced 35.3 percent. Tesla’s Shanghai-manufactured vehicles, exported to the EU, received an individually calculated rate of 9 percent following examination showing lower subsidy benefit relative to Chinese domestic producers. Combined with the EU’s standard 10 percent import tariff, total effective rates range from 17.8 percent for Tesla to 45.3 percent for SAIC. Germany and Hungary voted against the measure, reflecting the deep exposure of German manufacturers including Volkswagen, BMW, and Mercedes-Benz to the Chinese domestic market, where retaliatory measures carry significant commercial consequence, while France, Italy, Poland, and the Netherlands voted in favour.
A 2023 Rhodium Group study estimated that EU tariff rates would need to reach 45 to 55 percent to make the European market commercially unappealing for Chinese manufacturers based on existing profit margins. The SAIC rate falls within that range; the BYD rate of 17 percent does not. CSIS analysis suggested that BYD, even after absorbing the 17 percent countervailing duty, would generate higher EV profits in the EU than in the Chinese domestic market given European consumer prices. The practical consequence has been that Chinese EV sales in Europe have continued growing despite the tariffs, with BYD outselling Tesla in the European market in April 2025, and Chinese brands responding to tariff exposure by accelerating European production localisation, with BYD constructing manufacturing facilities in Hungary and Turkey to serve EU markets with domestically produced vehicles exempt from countervailing duties.
The EU’s procedural approach, grounded in World Trade Organization anti-subsidy principles under the Agreement on Subsidies and Countervailing Measures, differs structurally from the American Section 301 mechanism. The American tariff requires only a determination that foreign practices burden American commerce; the WTO-consistent approach requires quantification of subsidy benefit and evidence of material injury to domestic industry. The European investigation found that the BEV value chain in China benefits from unfair subsidization which is causing a threat of economic injury to EU BEV producers. China filed a WTO dispute complaint against Canada’s 100 percent tariff in September 2024, and separately against EU measures, while retaliating with anti-dumping and anti-subsidy investigations targeting European agricultural products, cognac, and large-displacement internal combustion engine vehicles. The retaliatory dynamic reflects a recognition that the trade conflict extends beyond electric vehicles into broader questions of market access, manufacturing location, and the distribution of value in the clean energy transition.
Figure 1: Global EV Battery Market Share by Manufacturer, 2024
V. The Consumer Costs of Managed Markets
The analytical literature on the employment effects of the first Trump administration’s Section 301 tariffs does not establish clear positive outcomes. Research by Autor, Caliendo, Larsen, and McLaren, published as a National Bureau of Economic Research Working Paper in 2024, found that the Trump tariffs had little or no employment effects and may in some contexts have reduced income, through mechanisms including intermediate input cost increases passed through to American manufacturers. The Centre for International Trade Policy at the University of Exeter characterised the economic rationale of the proposed EV tariffs as complex and unclear, noting that tariffs on Chinese intermediate inputs, lithium-ion batteries, permanent magnets, critical minerals, risked increasing American manufacturers’ own production costs and thus competitiveness.
The market outcome most directly attributable to the combined tariff and IRA-FEOC exclusion architecture is that electric vehicle adoption in the United States decelerated relative to projections and relative to comparable markets. EV penetration of new car sales in China reached 48 percent in 2024; EU penetration exceeded 20 percent for fully electric vehicles, with broader electrification running higher; Brazilian EV sales grew over 90 percent year on year driven substantially by Chinese manufacturers including BYD and Great Wall Motor offering vehicles in the $20,000 to $25,000 price range. American EV adoption, by contrast, showed stagnation or flat growth in several months of 2024, with average transaction prices remaining above $50,000 and the entry-level market segment, the consumer category most sensitive to price, essentially unserved by the domestic offering.
The internal tension in American EV policy is that the instruments deployed to protect domestic automotive manufacturing from Chinese competition also operated to sustain the price level that was suppressing domestic consumer adoption. Tariffs did not make domestic vehicles cheaper; they prevented cheaper imports. The IRA’s FEOC provisions directed consumer subsidies toward higher-cost qualifying vehicles, partially offsetting but not eliminating the price gap between American-manufactured EVs and what Chinese manufacturers were demonstrating was technically achievable at scale. The net effect was a market frozen at a price that most potential buyers declined to pay, generating a slower, more controlled transition that benefited incumbent American manufacturers’ adjustment timelines while deferring the broader energy transition benefits that accelerated electrification would have produced.
Whether this trade-off was commercially or strategically rational depends on what objective one attributes to the policy. On the objective of protecting domestic automotive employment and manufacturing capacity during a structural technological transition, the policies provided meaningful breathing room for American original equipment manufacturers and their supplier networks. Ford’s investment in its BlueOval SK battery joint venture with SK On, General Motors’ Ultium Cells partnership with LG Energy Solution, and Stellantis’s investments in North American battery capacity were all facilitated by the market protection that tariff and subsidy rules provided against immediate Chinese cost competition. On the objective of accelerating American consumer adoption of electric vehicles, the policies produced demonstrably inferior outcomes relative to markets where Chinese-manufactured vehicles at competitive price points were accessible.
VI. Structural Contestation and the Global Supply Chain Problem
The deeper structural challenge for Western EV policy extends beyond tariff levels. Chinese dominance in battery manufacturing is not solely a consequence of subsidy support; it reflects a decade of process innovation, supply chain integration, and chemistry-specific expertise accumulated at volumes that Western manufacturers are only beginning to approach. CATL’s CATL’s Qilin battery architecture, which integrates cooling plates within the cell structure to achieve an energy density of 255 Wh per kilogram, was developed through sustained internal R&D investment that CATL’s annual report data show was itself substantially supported by Chinese government subsidies, CATL’s government subsidy receipts rose from $76.7 million in 2018 to $809.2 million in 2023 according to CSIS analysis of company filings. The BYD Blade battery’s ability to pass nail-penetration safety tests without thermal runaway solved a fundamental LFP safety challenge in ways that expanded the technology’s applicability to premium vehicle segments.
American and European battery manufacturing investments, however substantial in absolute terms, face a structural disadvantage rooted in the supply chain geography of critical mineral processing. Approximately 70 percent of the nickel sulphate used in nickel-manganese-cobalt battery cathodes is sourced from Indonesia, and China processes the majority of global lithium, cobalt, and graphite through refining facilities whose capacity took years to build and cannot be replicated rapidly without comparable capital mobilisation. The IRA’s FEOC provisions attempt to incentivise supply chain reorientation toward allied-nation sources, but the practical availability of non-Chinese processing capacity for the volumes required by an accelerated American electrification programme remained constrained as of 2024 to 2025.
China’s overcapacity problem provides a partial qualification to the competitive threat narrative. Research published in The Diplomat in December 2025 drew on data showing that EV production capacity in China exceeded domestic demand by a factor of three, that as of August 2025 only three Chinese EV companies, BYD, Li Auto, and Aito, were profitable, and that the broader pattern of investment-led overproduction reflected a structural feature of Chinese industrial organisation rather than purely strategic aggression. CSIS’s Kennedy similarly noted in the Chinese EV Dilemma analysis that despite extensive government support, very few Chinese EV producers and battery makers are profitable, and that in a well-functioning market economy, the investment-demand gap would typically result in consolidation rather than sustained expansion. Whether this overcapacity persists or corrects through market forces will significantly affect the competitive trajectory over the medium term.
The WTO dispute architecture surrounding EV tariffs remained unresolved as of mid-2026. China’s complaints against the United States, Canada, and the European Union proceed through a multilateral dispute resolution system that the United States has partially disabled by blocking Appellate Body appointments since 2017, meaning that adverse panel rulings cannot be appealed through the standard mechanism and American Section 301 measures face limited multilateral constraint. The EU’s WTO-grounded procedural approach creates marginally greater exposure to dispute resolution findings but reflects a calculated preference for maintaining the appearance of rules-based trade governance while still achieving protective outcomes.
The competitive pressure on European automotive manufacturers may prove more consequential than the tariff architecture suggests. BMW, Volkswagen, Mercedes-Benz, and Stellantis all manufacture vehicles in China for Chinese domestic consumption and, in some cases, for export to European markets through supply chains that the countervailing duty regime now taxes. German opposition to EU tariffs reflected the calculation that Chinese retaliatory measures on European automobile exports to China — a market representing 30 to 40 percent of German manufacturer revenues — would impose greater economic cost than the protective benefit of Chinese EV exclusion from Europe. The fundamental strategic divergence within EU member state preferences over Chinese EV tariffs mirrors a broader disagreement about whether the energy transition should be pursued through competition or through managed industrial policy, with no durable consensus visible as of 2026.
Authored By: Global GeoPolitics
If you prefer to make a one time donation in support of my work, you can do so by clicking any link below:
https://buymeacoffee.com/ggtv |
https://ko-fi.com/globalgeopolitics |
Bitcoin: 3NiK8BoRZnkwJSHZSekuXKFizGPopkE7ns
References
American Security Project. (2025, August 18). White Paper – Charging Ahead: How the U.S. Can Close the Gap in the EV Race. https://www.americansecurityproject.org/charging-ahead/
American Society of International Law (ASIL). (2025, October 7). Electric Vehicle Tariffs by the US, EU, and Canada: Different Approaches and Implications for the WTO. ASIL Insights, 28(12). https://www.asil.org/insights/volume/28/issue/12
Autor, D., Caliendo, L., Larsen, M. A., & McLaren, J. (2024). Help for the Heartland? The Employment and Electoral Effects of the Trump Tariffs in the United States. NBER Working Paper 32082. National Bureau of Economic Research.
Carbon Brief. (2024, September 10). Q&A: The global “trade war” over China’s booming EV industry. https://www.carbonbrief.org/qa-the-global-trade-war-over-chinas-booming-ev-industry/
Centre for International Trade Policy (CITP), University of Exeter. (2024, June 6). US tariffs on EVs: Pre-emptive or political? https://citp.ac.uk/publications/us-tariffs-on-evs-pre-emptive-or-political
China Passenger Car Association (CPCA). (2025, January). 2024 Annual NEV Sales Data [data release]. CnEVPost. https://cnevpost.com/2025/01/10/automakers-share-china-nev-market-2024/
Cleary Foreign Investment and International Trade Watch. (2024, October 15). Definitive Duties Adopted by the EU on Chinese Battery Electric Vehicles. https://www.clearytradewatch.com/2024/10/definitive-duties-adopted-by-the-eu-on-chinese-battery-electric-vehicles-to-counteract-subsidies-to-apply-by-october-30/
CnEVPost. (2025, February 11). Global EV battery market share in 2024: CATL 37.9%, BYD 17.2%. https://cnevpost.com/2025/02/11/global-ev-battery-market-share-2024/
CnEVPost. (2026, February 4). Global EV battery market share in 2025. https://cnevpost.com/2026/02/04/global-ev-battery-market-share-2025/
CSIS (Center for Strategic and International Studies). (2024). The Chinese EV Dilemma: Subsidized Yet Striking. Kennedy, S. [Trustee China Hand blog]. https://www.csis.org/blogs/trustee-china-hand/chinese-ev-dilemma-subsidized-yet-striking
The Diplomat. (2025, December 23). After the Subsidies: EVs and Lessons from China’s Industrial Policy. https://thediplomat.com/2025/12/after-the-subsidies-evs-and-lessons-from-chinas-industrial-policy/
European Commission. (2024, October). Commission Implementing Regulation (EU) 2024/2754 imposing a definitive countervailing duty on imports of new battery electric vehicles designed for the transport of persons originating in the People’s Republic of China. Official Journal of the European Union.
IISS (International Institute for Strategic Studies). (2024, October 31). The EU’s approach to tariffs on Chinese electric vehicles. Strategic Comments. https://www.iiss.org/publications/strategic-comments/2024/10/the-eus-approach-to-tariffs-on-chinese-electric-vehicles/
ING Think. (2024, December 10). Chinese EV tariffs push production in Europe; Western brands set to feel the impact too. https://think.ing.com/articles/eus-final-decision-on-tariffs-for-evs-from-china/
Information Technology and Innovation Foundation (ITIF). (2024, July 29). How Innovative Is China in the Electric Vehicle and Battery Industries? https://itif.org/publications/2024/07/29/how-innovative-is-china-in-the-electric-vehicle-and-battery-industries/
MIT Technology Review. (2023, February 21). How did China come to dominate the world of electric cars? https://www.technologyreview.com/2023/02/21/1068880/how-did-china-dominate-electric-cars-policy/
Roosevelt Institute. (2024, April 17). Why This Matters: Section 301 Tariffs on Electric Vehicles. https://rooseveltinstitute.org/blog/section-301-tariffs-on-electric-vehicles/
ScienceDirect / Research Policy. (2025, November 28). China’s technological catch-up and leapfrogging in electric vehicles: A firm-level study of BYD and CATL. https://www.sciencedirect.com/science/article/pii/S2949694225000197
SHS Conferences (EDP Sciences). (2024). The Impact of Government Subsidies on Electric Vehicle Sales: A Regression Analysis of BYD in China. https://www.shs-conferences.org/articles/shsconf/pdf/2024/27/shsconf_icdeba2024_03017.pdf
SNE Research. (2024, 2025). Global EV Battery Market Share Reports [data cited in CnEVPost, Carbon Credits, ScienceDirect].
Tesla, Inc. (2019). Form 8-K Q4 and Full Year 2018. Securities and Exchange Commission. https://www.sec.gov/Archives/edgar/data/0001318605/000156459019001399/tsla-ex991_6.htm
US Congress. (2024). H. Rept. 118-550 – End Chinese Dominance of Electric Vehicles in America Act of 2024. Committee on Ways and Means. https://www.congress.gov/congressional-report/118th-congress/house-report/550
US Trade Representative (USTR). (2024, May 14). Fact Sheet: President Biden Takes Action to Protect American Workers and Businesses from China’s Unfair Trade Practices. https://www.whitehouse.gov/briefing-room/statements-releases/2024/05/14/
Wikipedia. (2026). Gigafactory Shanghai. https://en.wikipedia.org/wiki/Gigafactory_Shanghai

Leave a comment