

How the largest capital expenditure programme in corporate history is being financed by debt rather than profit, sustained by narrative rather than demonstrated returns, and protected from scrutiny by a geopolitical strategy that punishes governments which attempt to build economies around public benefit rather than private accumulation
This paper examines three interlocking phenomena that together characterise the political economy of the mid-2020s: the unprecedented and largely debt-financed capital expenditure programme of the five major American technology corporations, collectively committing between $660 billion and $725 billion to artificial intelligence infrastructure in 2026 alone; the structural fragility of financial markets now so concentrated in semiconductor and AI-adjacent equities that a single company’s guidance revision can trigger circuit breakers in the world’s sixth-largest stock exchange; and the geopolitical pressure applied by Washington against governments, most recently Mexico under President Claudia Sheinbaum, that demonstrate through practical policy that public welfare expenditure and state-directed industrial strategy can produce measurable improvements in living standards without recourse to the private capital markets upon which the AI supercycle ultimately depends. Drawing on corporate financial filings, earnings call transcripts, Federal Reserve and Bank of England data, KOSPI market data, Congressional Research Service analyses, Wilson Center energy policy research, and financial analysis from Allianz Economic Research, Goldman Sachs, JP Morgan, CreditSights, and Epoch AI, the essay argues that the AI investment cycle exhibits structural characteristics, a widening gap between capital deployed and revenue generated, leverage replacing cash flow, market breadth collapsing beneath index-level euphoria, that have preceded each of the three major speculative corrections of the past quarter century. It further argues that the hostility of American financial and political institutions toward economically sovereign governments is not incidental to this dynamic but integral to it, since the viability of the accumulation model requires the absence of any demonstrably successful alternative.
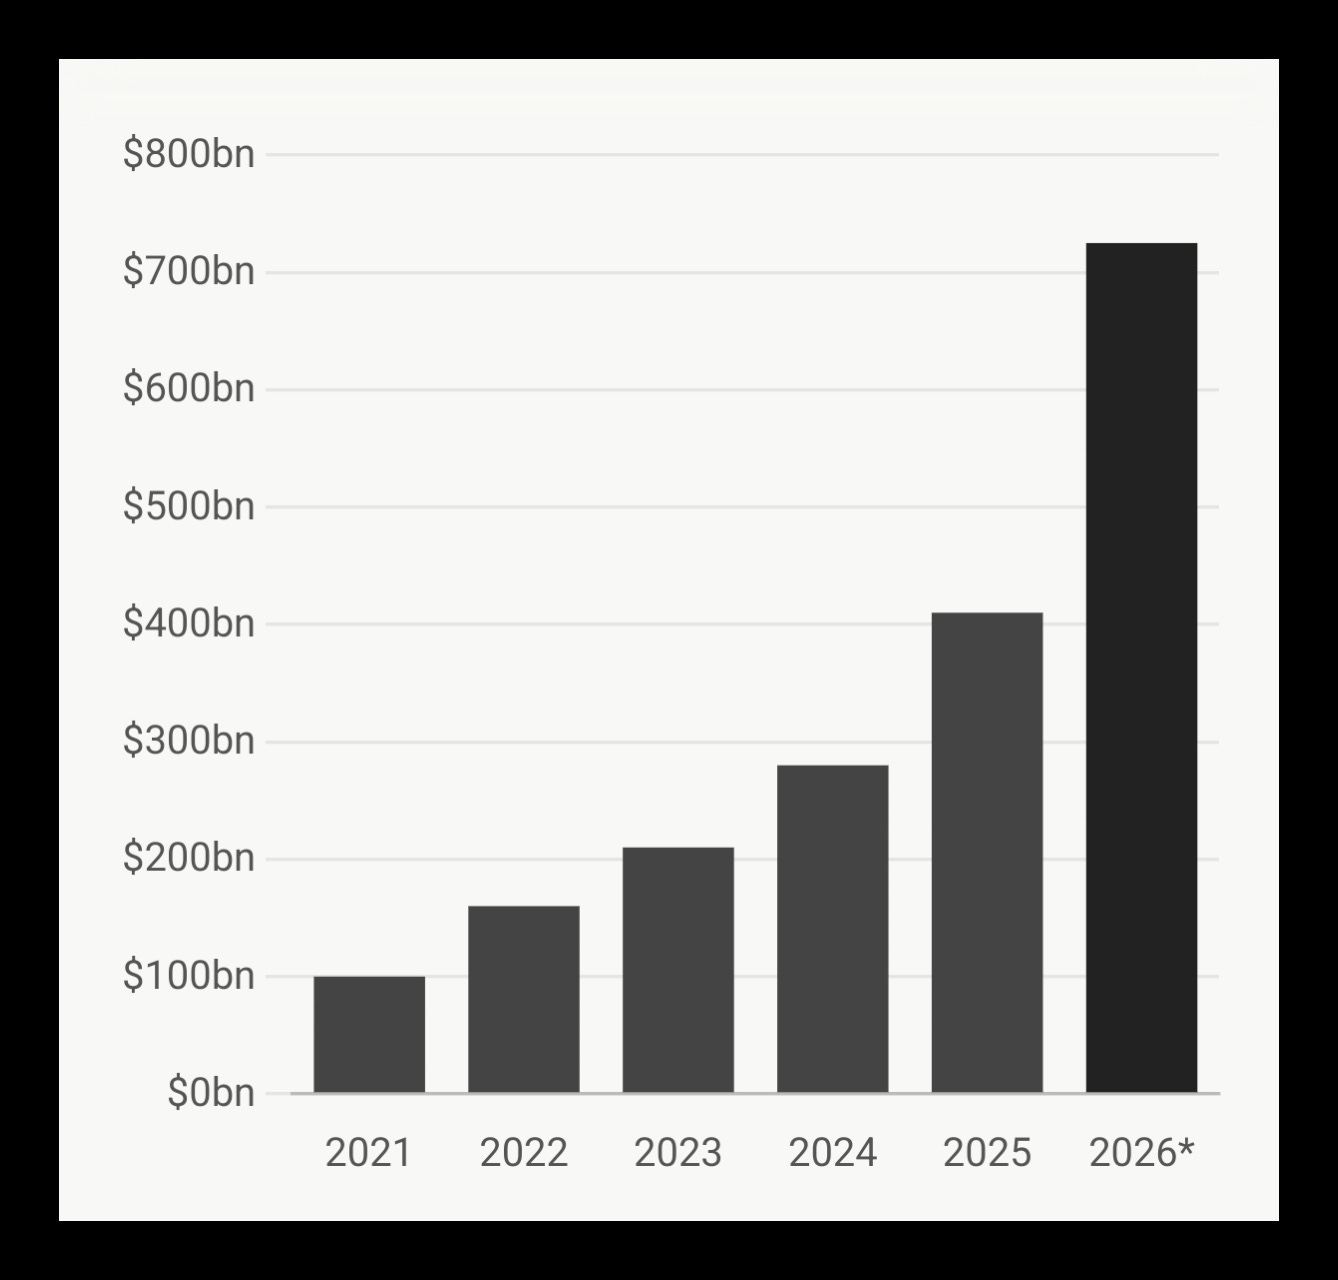
The five largest American technology corporations, Amazon, Alphabet, Microsoft, Meta, and Oracle, collectively committed between $660 billion and $725 billion to capital expenditure in 2026, a figure representing an increase of approximately 77 percent over the previous year’s record of $410 billion, according to first-quarter earnings data compiled by the Financial Times. Amazon alone projected $200 billion in capital outlays, compared with $125 billion in 2025. Alphabet raised its guidance to between $185 billion and $190 billion. Microsoft set its calendar-year figure at $190 billion, well above the $152 billion average analyst estimate, with Chief Financial Officer Amy Hood attributing $25 billion of the increment to rising memory chip and component costs. Meta guided for between $115 billion and $135 billion. Epoch AI, drawing on company financial filings, calculated that the combined capital expenditure of these five firms had been growing at an annualised rate of 72 percent since the second quarter of 2023, suggesting that if the trajectory continued, aggregate spending could reach $770 billion before the year’s end.
Figure 1
Combined hyperscaler capital expenditure, 2021–2026
Amazon, Alphabet, Microsoft, Meta, Oracle – USD billions
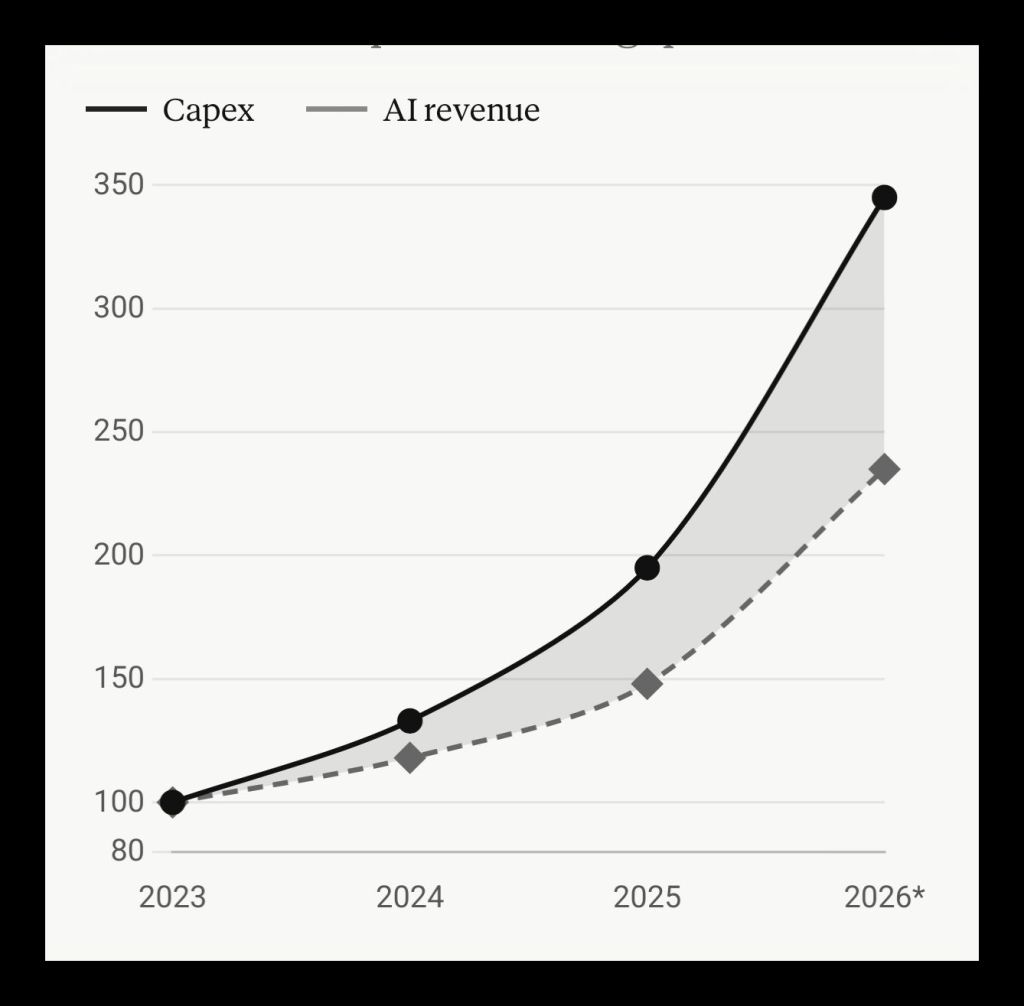
The question that these figures demand and that the quarterly earnings cycle has been structurally designed to defer, is whether the revenue being generated or credibly projected bears any proportion to the capital being consumed. The answer, examined carefully, is less reassuring than the market’s record valuations suggest. Goldman Sachs estimated that the hyperscalers as a group would consume approximately 94 percent of their operating cash flow on AI infrastructure expenditure alone, before accounting for debt servicing, dividends, or share buybacks. CreditSights, in its December 2025 analysis of hyperscaler financing, confirmed that aggregate capital expenditure across the five companies, after buybacks and dividends were included, had risen above projected free cash flow, requiring external funding. Amazon’s free cash flow was projected to turn negative in 2026 for the first time in the company’s history, with Morgan Stanley estimating a deficit of $17 billion and Bank of America placing the figure at $28 billion. Alphabet executed its first equity raise in twenty years, issuing $80 billion in stock to fund infrastructure that its operating cash flow could no longer support. These were not startup enterprises burning venture capital. They were, until recently, the most cash-generative corporations in human history.
The debt transition has been swift and substantial. Hyperscalers raised $108 billion in bond markets during 2025 alone, according to the IEEE Communications Society Technology Blog’s December 2025 analysis, with projections of $1.5 trillion in debt issuance required over the coming years if the current investment trajectory is maintained. Capital intensity at Microsoft reached 45 percent of revenue, at Oracle 57 percent, ratios historically associated with regulated utility companies rather than technology firms whose valuations rest on assumptions of capital-light scalability. Allianz Economic Research, in its March 2026 special report on AI infrastructure investment, noted that capital expenditure was expanding approximately 46 percent faster than revenue, a divergence that exceeded the 32 percent gap observed during the telecommunications excess of the dot-com cycle. The EV/EBITDA multiples for AI and technology equities were, at that point, running near 25 times, close to historical extremes and above the telecom valuations that preceded the 2000 correction.
Figure 2
Capital expenditure growth vs. AI-attributable revenue growth, 2023–2026
Year-on-year growth indexed to 2023 = 100. Shaded area represents the gap.
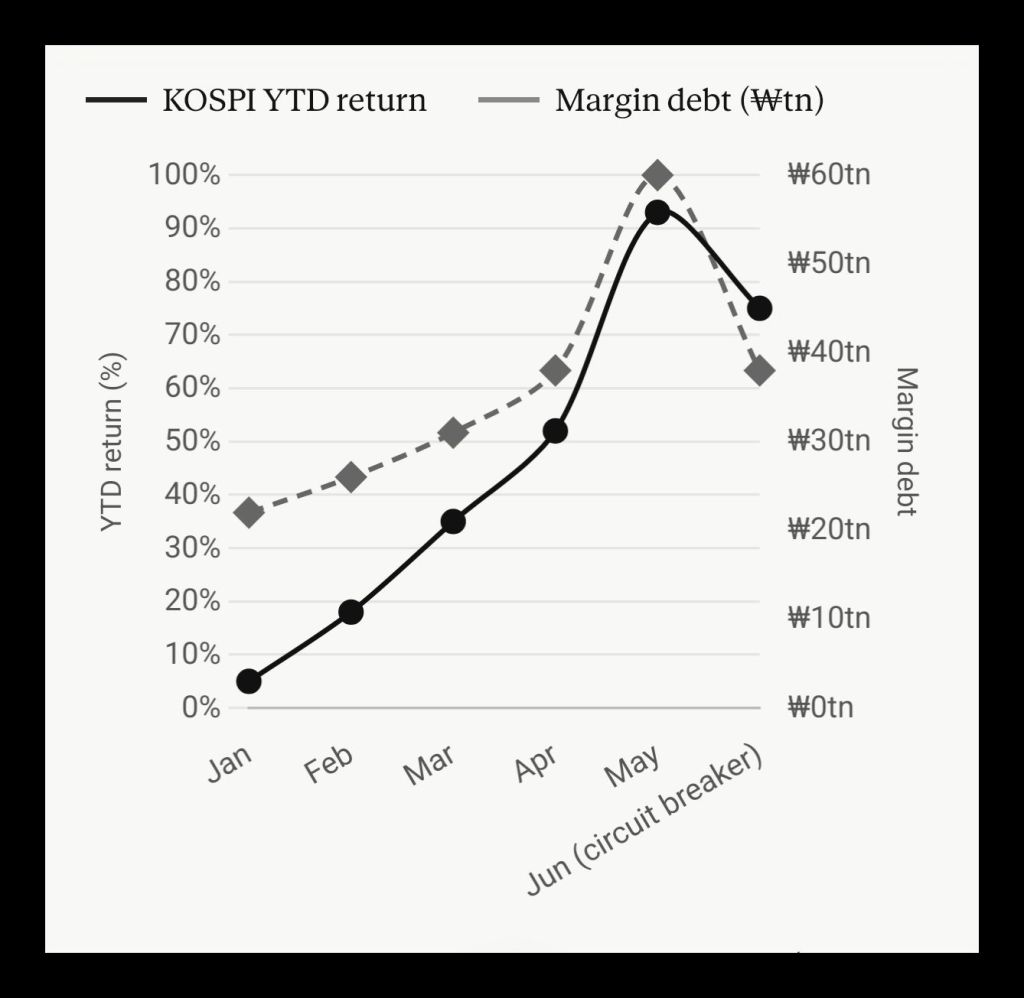
The Broadcom earnings release of 3 June 2026 offered a compressed illustration of the dynamic Allianz had described. The company’s fiscal second-quarter results showed AI revenue that had tripled year on year, overall sales growth of 48 percent, and profits that exceeded every Wall Street estimate. The market’s response was to erase $320 billion in Broadcom’s market capitalisation in a single trading session. The explanation for this apparently contradictory reaction lies in the structure of expectation that had been built around the AI narrative: tripling was no longer sufficient because the expectation embedded in the share price had assumed something beyond tripling. Broadcom’s chief executive, Hock Tan, disclosed during the earnings call that Google was already exploring cheaper alternatives to Broadcom’s custom AI chips, that the company had retreated from selling complete AI systems in favour of selling bare chips at reduced margins, and that despite what management described as unprecedented demand, he declined to raise his full-year revenue forecast. Foreign investors had absorbed that information and sold. The KOSPI circuit breaker on 8 June 2026 was the proximate consequence.
South Korea’s semiconductor market had by then developed the structural characteristics of a speculative crisis in formation. The KOSPI had risen more than 93 percent year-to-date at its 2026 peak, reaching above 8,800. Samsung Electronics and SK Hynix together accounted for approximately half of the entire index’s market capitalisation and had contributed roughly 70 percent of its year-to-date gains. The remaining 800-plus listed companies had contributed less than 30 percent to the index’s advance, a dispersion that a statistical analysis published by Sina Finance described as a ‘K-shaped divergence’ with no structural buffer against concentrated sector reversals. Retail margin debt in South Korea had reached a record 37.74 trillion won as of 4 June 2026, per TradingKey’s market data, rising to 60 trillion won by the end of May according to separate data compiled by Crypto Briefing, approximately $39 billion in borrowed money placed overwhelmingly into semiconductor positions by domestic retail investors. South Korea had 102 million active trading accounts in a country of 52 million people, meaning average account penetration exceeded two per citizen. Christian Heck of First Eagle Investment Management, quoted by ZeroHedge, framed the implication directly: ‘buying the index is not simply buying a diversified slice of Korea; it is increasingly a concentrated bet on memory semiconductors.’
Figure 3
Semiconductor weight in the S&P 500, selectedyearsP
Percentage of total index market capitalisation
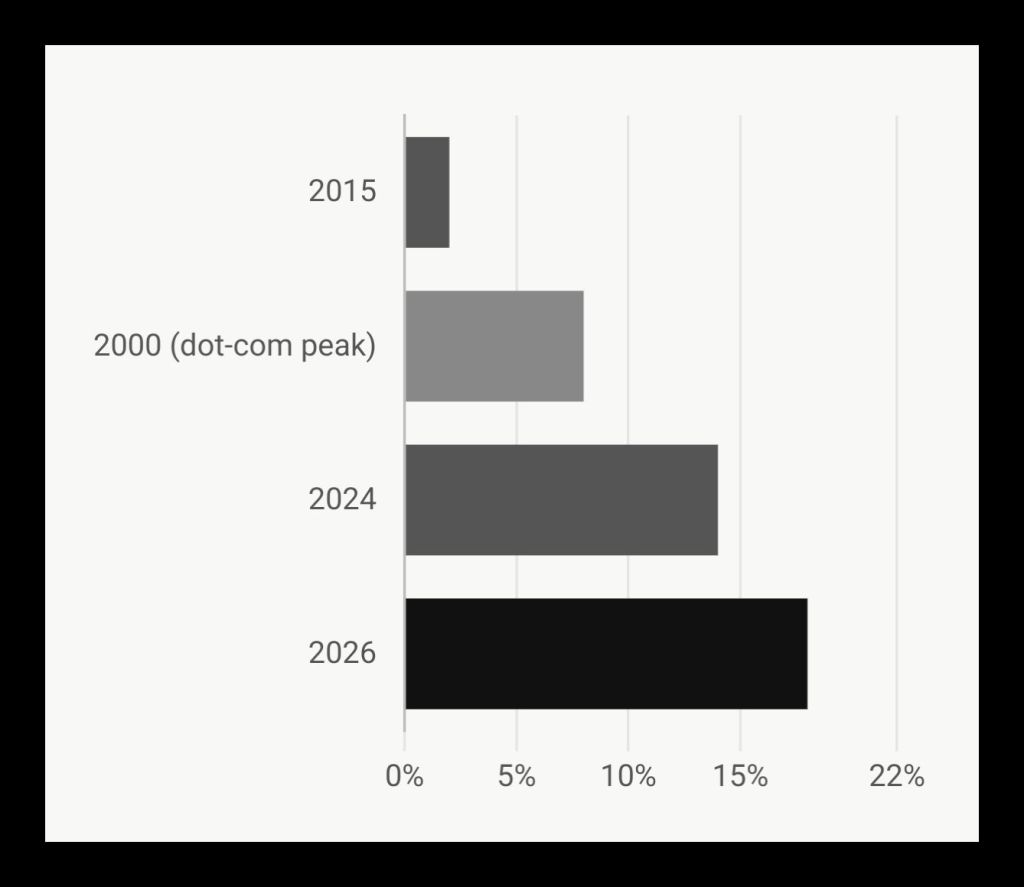
On 8 June 2026, the circuit breaker activated within minutes of market open as the KOSPI fell 8.37 percent. Samsung and SK Hynix each fell 10 percent. Foreign institutional investors had been net sellers for nine consecutive days before the circuit breaker fired, with domestic retail absorbing the distributed supply using borrowed funds. When semiconductor prices dropped below margin maintenance thresholds, forced liquidations began executing automatically, pushing prices lower still and triggering further margin calls in a sequence that the European Business Magazine described as ‘structural fragility that had been building inside the Korean market for months.’ The parallel to previous speculative cycles is not difficult to draw. Cameron Dawson, chief investment officer at NewEdge Wealth, observed in widely circulated commentary that semiconductor stocks had risen from 2 percent of S&P 500 market capitalisation a decade ago to 18 percent in 2026, more than double their peak weighting during the technology bubble of 2000. The top ten S&P 500 companies now controlled approximately 40 percent of the entire index, a level that had not merely matched but exceeded the dot-com peak concentration when the top ten held approximately 27 percent, according to data from Charles Schwab and Bloomberg. In a 28-session rally between late March and early May 2026, analysts at Nomura found that just ten stocks drove 69 percent of the index’s gains.
Figure 4
KOSPI year-to-date return and retail margin debt, 2026

The revenue question is not academic. None of the hyperscalers had demonstrated positive return on investment on their AI infrastructure at scale as of the reporting period covered by Tech Insider’s April 2026 analysis of Q1 earnings. Futurum Group’s February 2026 assessment of the capex cycle noted that infrastructure built in 2026 could take between 18 and 36 months to generate proportional returns, meaning that the capital being committed this year will not demonstrate its viability until 2027 or 2028 at the earliest. Princeton University’s Center for Information Technology Policy found that graphics processing units, the core computational asset underlying the AI infrastructure buildout, carry useful lives of one to three years, yet the hyperscalers were depreciating them over five to six years, a gap that researchers characterised as representing hundreds of billions of dollars in future earnings impairment embedded silently in corporate balance sheets. When Meta’s chief executive Mark Zuckerberg was asked directly about the return on investment on Meta’s $145 billion AI capital expenditure programme during the Q1 2026 earnings call, he described it as ‘a very technical question.’ The stock fell 6 percent, on a quarter in which revenue had risen 33 percent and profits 61 percent. The market had spent two years tolerating qualitative answers about AI monetisation. The Q1 2026 earnings season indicated that patience was contracting.
Against this backdrop of capital accumulation operating increasingly at variance with productive returns, the geopolitical behaviour of Washington toward governments that decline to organise their economies around the same accumulation logic becomes analytically legible rather than merely diplomatic. Mexico under President Claudia Sheinbaum presents a case study in what American financial and strategic institutions identify as an intolerable combination: a large, resource-rich country on the United States’ southern border governed by a programme that redirects state revenues toward public welfare rather than private capital markets, and that has demonstrated through measurable policy outcomes that this approach is feasible. Sheinbaum’s government has maintained her predecessor Andrés Manuel López Obrador’s constitutional consolidation of the energy sector, folding the Energy Regulatory Commission and the National Hydrocarbons Commission into the government’s Energy Ministry through a December 2024 constitutional amendment, thereby centralising oversight of Pemex and the Comisión Federal de Electricidad within direct state control. The Wilson Center’s January 2025 analysis of Mexico’s energy constitutional reforms noted that the United States had already filed USMCA dispute settlement consultations in June 2022 over what Washington described as Mexican policy undermining American energy companies in favour of state enterprises, a complaint that remained unresolved ahead of the 2026 USMCA review.
The policy record that accompanies this structural decision about energy sovereignty is worth setting out in concrete terms. López Obrador’s six-year administration raised the minimum wage from 4.75 dollars per day to 15 dollars per day, a tripling, and raised 13.4 million Mexicans out of poverty, according to government data cited in multiple analyses of the MORENA policy programme. Sheinbaum introduced a universal scholarship programme for children, launched a zero-percent interest mortgage programme for affordable housing, reduced the working week from 48 to 40 hours through congressional legislation, and extended formal labour rights, including medical coverage, paid leave, accident compensation, pension entitlements, a year-end bonus, and profit-sharing, to app-based delivery and ride-share workers. The Congressional Research Service’s February 2026 Mexico briefing noted that Sheinbaum maintained approval ratings near or above 70 percent throughout the period. Her Plan México, a five-year development strategy oriented toward reducing import dependence, expanding domestic manufacturing, and creating 1.5 million jobs, was not a radical departure from the OECD consensus on development economics; it was, in substance, closer to the post-war industrial policies that built the economies of South Korea, Japan, Taiwan, and Germany. The objection from Washington was not principally economic in the technical sense. The objection was structural: a government demonstrating that the state, rather than the private capital market, can serve as the primary vehicle for improving mass living standards removes a pillar of the ideological justification for the accumulation model.
Figure 5
Mexico: selected welfare and wage indicators, 2018–2026
The tariff pressure applied by the Trump administration against Mexico from March 2025, a 25 percent levy on Mexican goods, and the broader framing of Mexico as a problem requiring American intervention followed a pattern familiar from earlier cycles of Washington pressure on Latin American governments. A leaked audio recording known as ‘Hondurasgate’ allegedly revealed coordination between Honduran President Juan Orlando Hernandez, allies of President Trump, Argentine President Javier Milei, and figures linked to Israel to establish a digital media operation targeting the governments of Mexico, Brazil, and Colombia with disinformation campaigns. The pattern of media pressure preceding coercive action, characterised by a series of prominent negative framing pieces in major American outlets presenting Mexico as a country requiring external rescue, conforms to documented historical practice in the region across several administrations. Sheinbaum’s response to the tariff announcement in March 2025 was measured: she stated that there was no motive, reason, or justification for penalties on two of the United States’ largest trading partners, and announced that Mexico would respond with reciprocal tariffs, while her five-step economic plan emphasised domestic market strengthening, food and energy self-sufficiency, and continued public investment.
The analytical thread connecting the AI capital expenditure cycle, the KOSPI circuit breaker, and Washington’s posture toward Mexico runs through the structural requirements of financialised capitalism at its current stage of development. The AI supercycle is being financed not by demonstrated productive returns but by the perpetual expectation of future returns, a dynamic that requires sustained market confidence, sustained inflow of passive investment capital through index funds and ETFs, and the absence of any credible alternative model that might redirect capital or political legitimacy away from the accumulation framework. The bond market, the $24 trillion Treasury market that serves as collateral for the global derivatives and repo system, has been signalling stress that the equity market has consistently declined to incorporate. The Bank of England’s short-term repo facility allotment in early 2026 was, adjusted for the relative scale of the UK and American financial systems, equivalent to a drawdown of approximately $300 billion at the Federal Reserve’s standing repo window, double the peak drawdown recorded during the market freeze of March 2020. The private credit market reached a default rate of 6 percent in the first quarter of 2026, with outflows of over $14 billion representing a 146 percent increase from the preceding quarter, according to data cited by Fabio Vighi’s June 2026 analysis. JPMorgan Chase moved publicly to offload $4 billion in private-equity-linked loans, a modest figure by institutional standards, but one whose public visibility in the Financial Times suggested that transparency was serving a warning function rather than a commercial one.
The $5.3 trillion in combined capital expenditure that Goldman Sachs projected the four largest hyperscalers would deploy between fiscal years 2025 and 2030, cited in Yahoo Finance’s June 2026 analysis, represents the largest single-sector infrastructure commitment in corporate history, exceeding the railway buildouts of the nineteenth century in absolute dollar terms. Whether it represents the foundation of a genuinely transformative technological epoch or the terminal phase of a speculative cycle that has been in formation since the Federal Reserve’s post-2008 zero interest rate policy created conditions in which fictitious capital could expand without productive constraint is a question that market prices, in their current configuration, are structurally unable to answer. Prices are set at the margin by the most enthusiastic participants. The 102 million South Korean retail accounts that drove the KOSPI to 93 percent gains before the circuit breaker fired were not less enthusiastic than their American counterparts who have driven semiconductor concentration in the S&P 500 to more than double the dot-com peak. Their leverage was simply more visible, because South Korea’s regulatory disclosures are more granular.
The convergence of these dynamics in the first half of 2026, the capex-to-revenue divergence expanding to 46 percent above the telecommunications excess of 2001, semiconductor index weighting at historic extremes, the South Korean circuit breaker serving as the most legible early indicator of what forced deleveraging looks like at scale, and the simultaneous application of tariff and informational pressure against the Mexican government for the offence of demonstrating that social expenditure produces popular legitimacy, does not constitute proof of an imminent systemic break. It constitutes the conditions under which systemic breaks have historically developed. The dot-com correction of 2000 was not caused by the absence of genuine technological innovation; the internet was and remains a transformative infrastructure. The correction was caused by the gap between the capital deployed in anticipation of that transformation and the rate at which productive returns materialised. The gap Allianz identified in March 2026 between AI capex growth and AI revenue growth was, by that measure, already more severe than the comparable gap recorded in 2001. Whether the revenue acceleration that Jefferies described as a ‘$2 trillion backlog supporting the capex supercycle’ closes that gap at the rate the current market capitalisation requires is a question the next eighteen months of earnings will begin to answer with considerably less interpretive flexibility than the current cycle has permitted.
Authored By: Global GeoPolitics
If you prefer to make a one time donation in support of my work, you can do so by clicking any link below:
https://buymeacoffee.com/ggtv |
https://ko-fi.com/globalgeopolitics |
Bitcoin: 3NiK8BoRZnkwJSHZSekuXKFizGPopkE7ns
References
1. Epoch AI (2026). Hyperscaler Capex Trend. Available at: https://epoch.ai/data-insights/hyperscaler-capex-trend
2. Futurum Group (2026). AI Capex 2026: The $690B Infrastructure Sprint. 12 February 2026. Available at: https://futurumgroup.com/insights/ai-capex-2026-the-690b-infrastructure-sprint/
3. IEEE Communications Society Technology Blog (2025). Hyperscaler capex > $600bn in 2026 a 36% increase over 2025. 22 December 2025. Available at: https://techblog.comsoc.org/2025/12/22/hyperscaler-capex-600-bn-in-2026-a-36-increase-over-2025-while-global-spending-on-cloud-infrastructure-services-skyrockets/
4. Allianz Economic Research (2026). AI Capex Cycle: War-Proof for Now. Special Report, 25 March 2026. Available at: https://www.allianz.com/content/dam/onemarketing/azcom/Allianz_com/economic-research/publications/specials/en/2026/march/2026_03_25_AI.pdf
5. CNBC (2026). Tech AI spending approaches $700 billion in 2026, cash taking big hit. 6 February 2026. Available at: https://www.cnbc.com/2026/02/06/google-microsoft-meta-amazon-ai-cash.html
6. CNBC (2026). AI boom: Big Tech capital expenditures now seen topping $1 trillion in 2027. 30 April 2026. Available at: https://www.cnbc.com/2026/04/30/ai-boom-big-tech-capital-expenditures-now-seen-topping-1-trillion-in-2027-.html
7. Tom’s Hardware (2026). Google, Microsoft, Meta, and Amazon capex spending to hit $725 billion in 2026, up 77% from last year. 30 April 2026. Available at: https://www.tomshardware.com/tech-industry/big-tech/big-techs-ai-spending-plans-reach-725-billion
8. Goldman Sachs (2025). Why AI Companies May Invest More Than $500 Billion in 2026. Available at: https://www.goldmansachs.com/insights/articles/why-ai-companies-may-invest-more-than-500-billion-in-2026
9. MUFG Americas (2025). Financing the AI Supercycle: AI Chart Weekly. 19 December 2025. Available at: https://www.mufgamericas.com/sites/default/files/document/2025-12/AI_Chart_Weekly_12_19_Financing_the_AI_Supercycle.pdf
10. Tech Insider (2026). Big Tech AI Spending: The $700B Capex Race in 2026. 13 April 2026. Available at: https://tech-insider.org/big-tech-ai-infrastructure-spending-2026/
11. Seeking Alpha (2026). AI Capex ROI Becomes Key 2026 Test for Hyperscalers. 15 April 2026. Available at: https://seekingalpha.com/news/4575079-ai-capex-roi-becomes-key-2026-test-for-hyperscalers-investing-experts
12. StrongMocha (2026). The Earnings Call Gap: What Q1 2026 Just Told Us About AI ROI. June 2026. Available at: https://strongmocha.com/ai-infrastructure-data-centers/the-earnings-call-gap-what-q1-2026-just-told-us-about-ai-roi/
13. TradingKey (2026). South Korea’s KOSPI Plunges 8.37% at Opening, Triggers Circuit Breaker. 8 June 2026. Available at: https://www.tradingkey.com/analysis/stocks/more/261951350-kospi-crash-circuit-breaker-samsung-sk-hynix-broadcom-guidance-fed-hikes-retail-leverage-krw-outflow-tradingkey
14. European Business Magazine (2026). South Korea’s KOSPI Meltdown Sends a Warning to Every Market That Bet on AI. Available at: https://europeanbusinessmagazine.com/south-korea-kospi-ai-selloff-2026/
15. Crypto Briefing (2026). KOSPI Rallies 8.2% as Korean Retail Investors Buy the Dip While Foreigners Dump $3.7 Billion. 9 June 2026. Available at: https://cryptobriefing.com/kospi-rallies-retail-investors-margin-debt/
16. 247 Wall St. (2026). Semiconductor Exposure in S&P 500 Hits 18%. That’s More Than Double the Tech Bubble Peak. 18 May 2026. Available at: https://247wallst.com/investing/2026/05/18/semiconductor-exposure-in-sp-500-hits-18-thats-more-than-double-the-tech-bubble-peak/
17. ZeroHedge (2026). Korean Bubble Mania: Retail Investors Max Out on Margin Debt. Available at: https://www.zerohedge.com/markets/korean-bubble-mania-retail-investors-max-out-margin-debt-choose-risk-complete-collapse-miss
18. HTX Insights (2026). South Korea’s KOSPI Plunges 8.37% at Opening, Triggers Circuit Breaker: The ‘Two Stocks’ That Powered the Bull Market. 8 June 2026. Available at: https://www.htx.com/news/south-koreas-kospi-plunges-837-at-opening-triggers-circuit-b-bqP9yVny/
19. Financial Markets Content (2026). The Fragile Fifty Percent: J.P. Morgan Warns of Systemic ‘Tipping Point’ as S&P 500 Concentration Hits Record Highs. Available at: https://markets.financialcontent.com/stocks/article/marketminute-2026-1-26-the-fragile-fifty-percent-jp-morgan-warns-of-systemic-tipping-point-as-s-and-p-500-concentration-hits-record-highs
20. Wilson Center Mexico Institute (2025). Mexico Energy Industry Transformed by Constitutional Reforms. 3 January 2025. Available at: https://www.wilsoncenter.org/article/mexico-energy-industry-transformed-constitutional-reforms
21. Congressional Research Service (2026). Mexico: Background and Key Issues in U.S. Relations. CRS Report R48859. 23 February 2026. Available at: https://www.everycrsreport.com/reports/R48859.html
22. Fortune / Associated Press (2025). Claudia Sheinbaum fires back at Trump’s tariffs, saying Mexico will answer with its own. 4 March 2025. Available at: https://fortune.com/2025/03/04/mexico-tariffs-us-products-trump-claudia-sheinbaum
23. Americas Quarterly (2025). Reaction: What’s Next for Sheinbaum’s Tariff Strategy. 25 June 2025. Available at: https://www.americasquarterly.org/article/reaction-whats-next-for-sheinbaums-tariff-strategy/
24. Mexico News Daily (2025). Sheinbaum Previews Her 2026 Priorities. 19 December 2025. Available at: https://mexiconewsdaily.com/politics/sheinbaum-2026-goals-fridays-mananera-recapped/
25. Vighi, F. (2026). The Final Delusion – Capital Becoming Itself. Substack, 1 June 2026.
26. Yahoo Finance / Goldman Sachs via Bank of America data (2026). Meta, Microsoft, Amazon, and Alphabet are about to spend a shocking amount of money to dominate the AI era. Available at: https://finance.yahoo.com/sectors/technology/article/meta-microsoft-amazon-and-alphabet-are-about-to-spend-a-shocking-amount-of-money-to-dominate-the-ai-era-115359575.html

Leave a comment